This page was generated from `/home/lectures/exp3/source/notebooks/L10/MultiWave Interference.ipynb`_.
Multiple Wave Interference
Multiple Wave Interference with Decreasing Amplitude
We will turn our attention now to a slight modification of the previous multiwave interference. We will introduce a decreasing amplitude of the individual waves. The first wave shall have an amplitude
where
The intensity of the incident wave is multiplied by a factor
Intensity at Boundaries
The amplitude of the reflected wave is diminished by a factor
In the absence of absorption, reflectance
Consequently, the third wave would be now
|
|---|
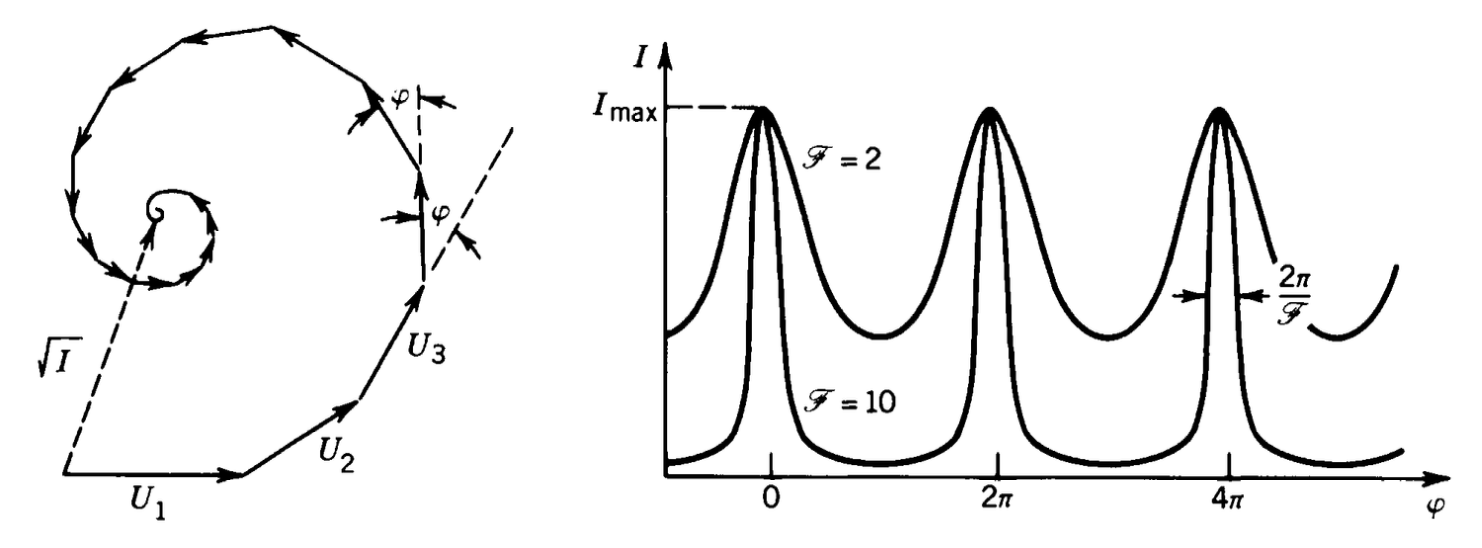
Fig.: Multiple wave interefence with decreasing amplitudes. Left: Phase construction of a multiwave intereference with M equal amplitude waves. Right: Intensity distribution obtained as a function of the phase shift |
This yields again
Calculating the intensity of the waves is giving
which is also known as the Airy function. This function can be further simplified by the following abbrevations
and
where the latter is called the Finesse. With those abbrevations, we obtain
for the interference of multiple waves with decreasing amplitude.
This intensity distribution has a different shape than the one we obtained for multiple waves with the same amplitude.
|
|---|
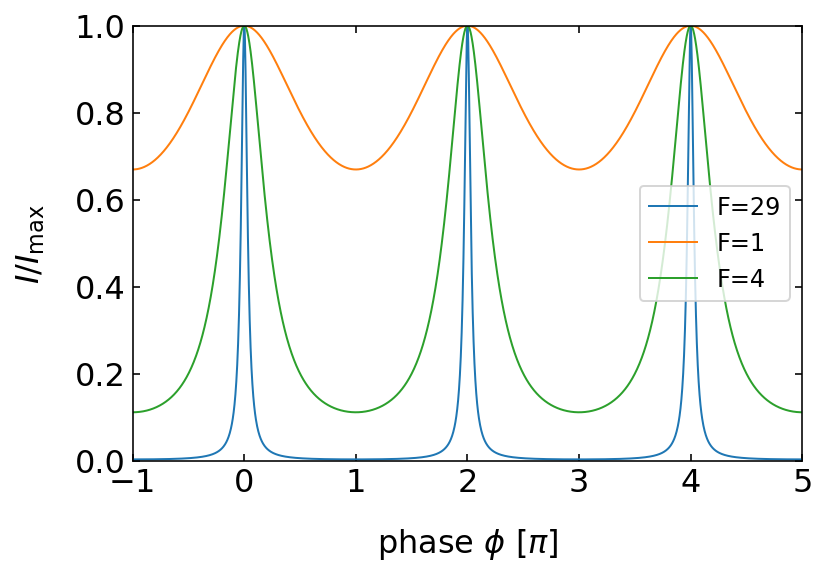
Fig.: Multiple wave interference with decreasing amplitude. The graph shows the intensity distribution over the phase angle |
We clearly observe that with increasing Finesse the intensity maxima, which occur at multiples fo


